Blog
Machine Translation Report
What is the optimal MT Engine for you? Find out in the latest MT Report by Memsource.
A new set of dashboards featuring localization analytics for jobs, costs, savings, and more is now available on the home page in Memsource Cloud.
The new home page analytics dashboards are available for users of Team, Ultimate, Biz Start, Biz Team, and Unlimited editions. They allow users to have an overview of their jobs and processes and to receive in-depth analysis of over 400 localization statistics as they log into their Cloud account.
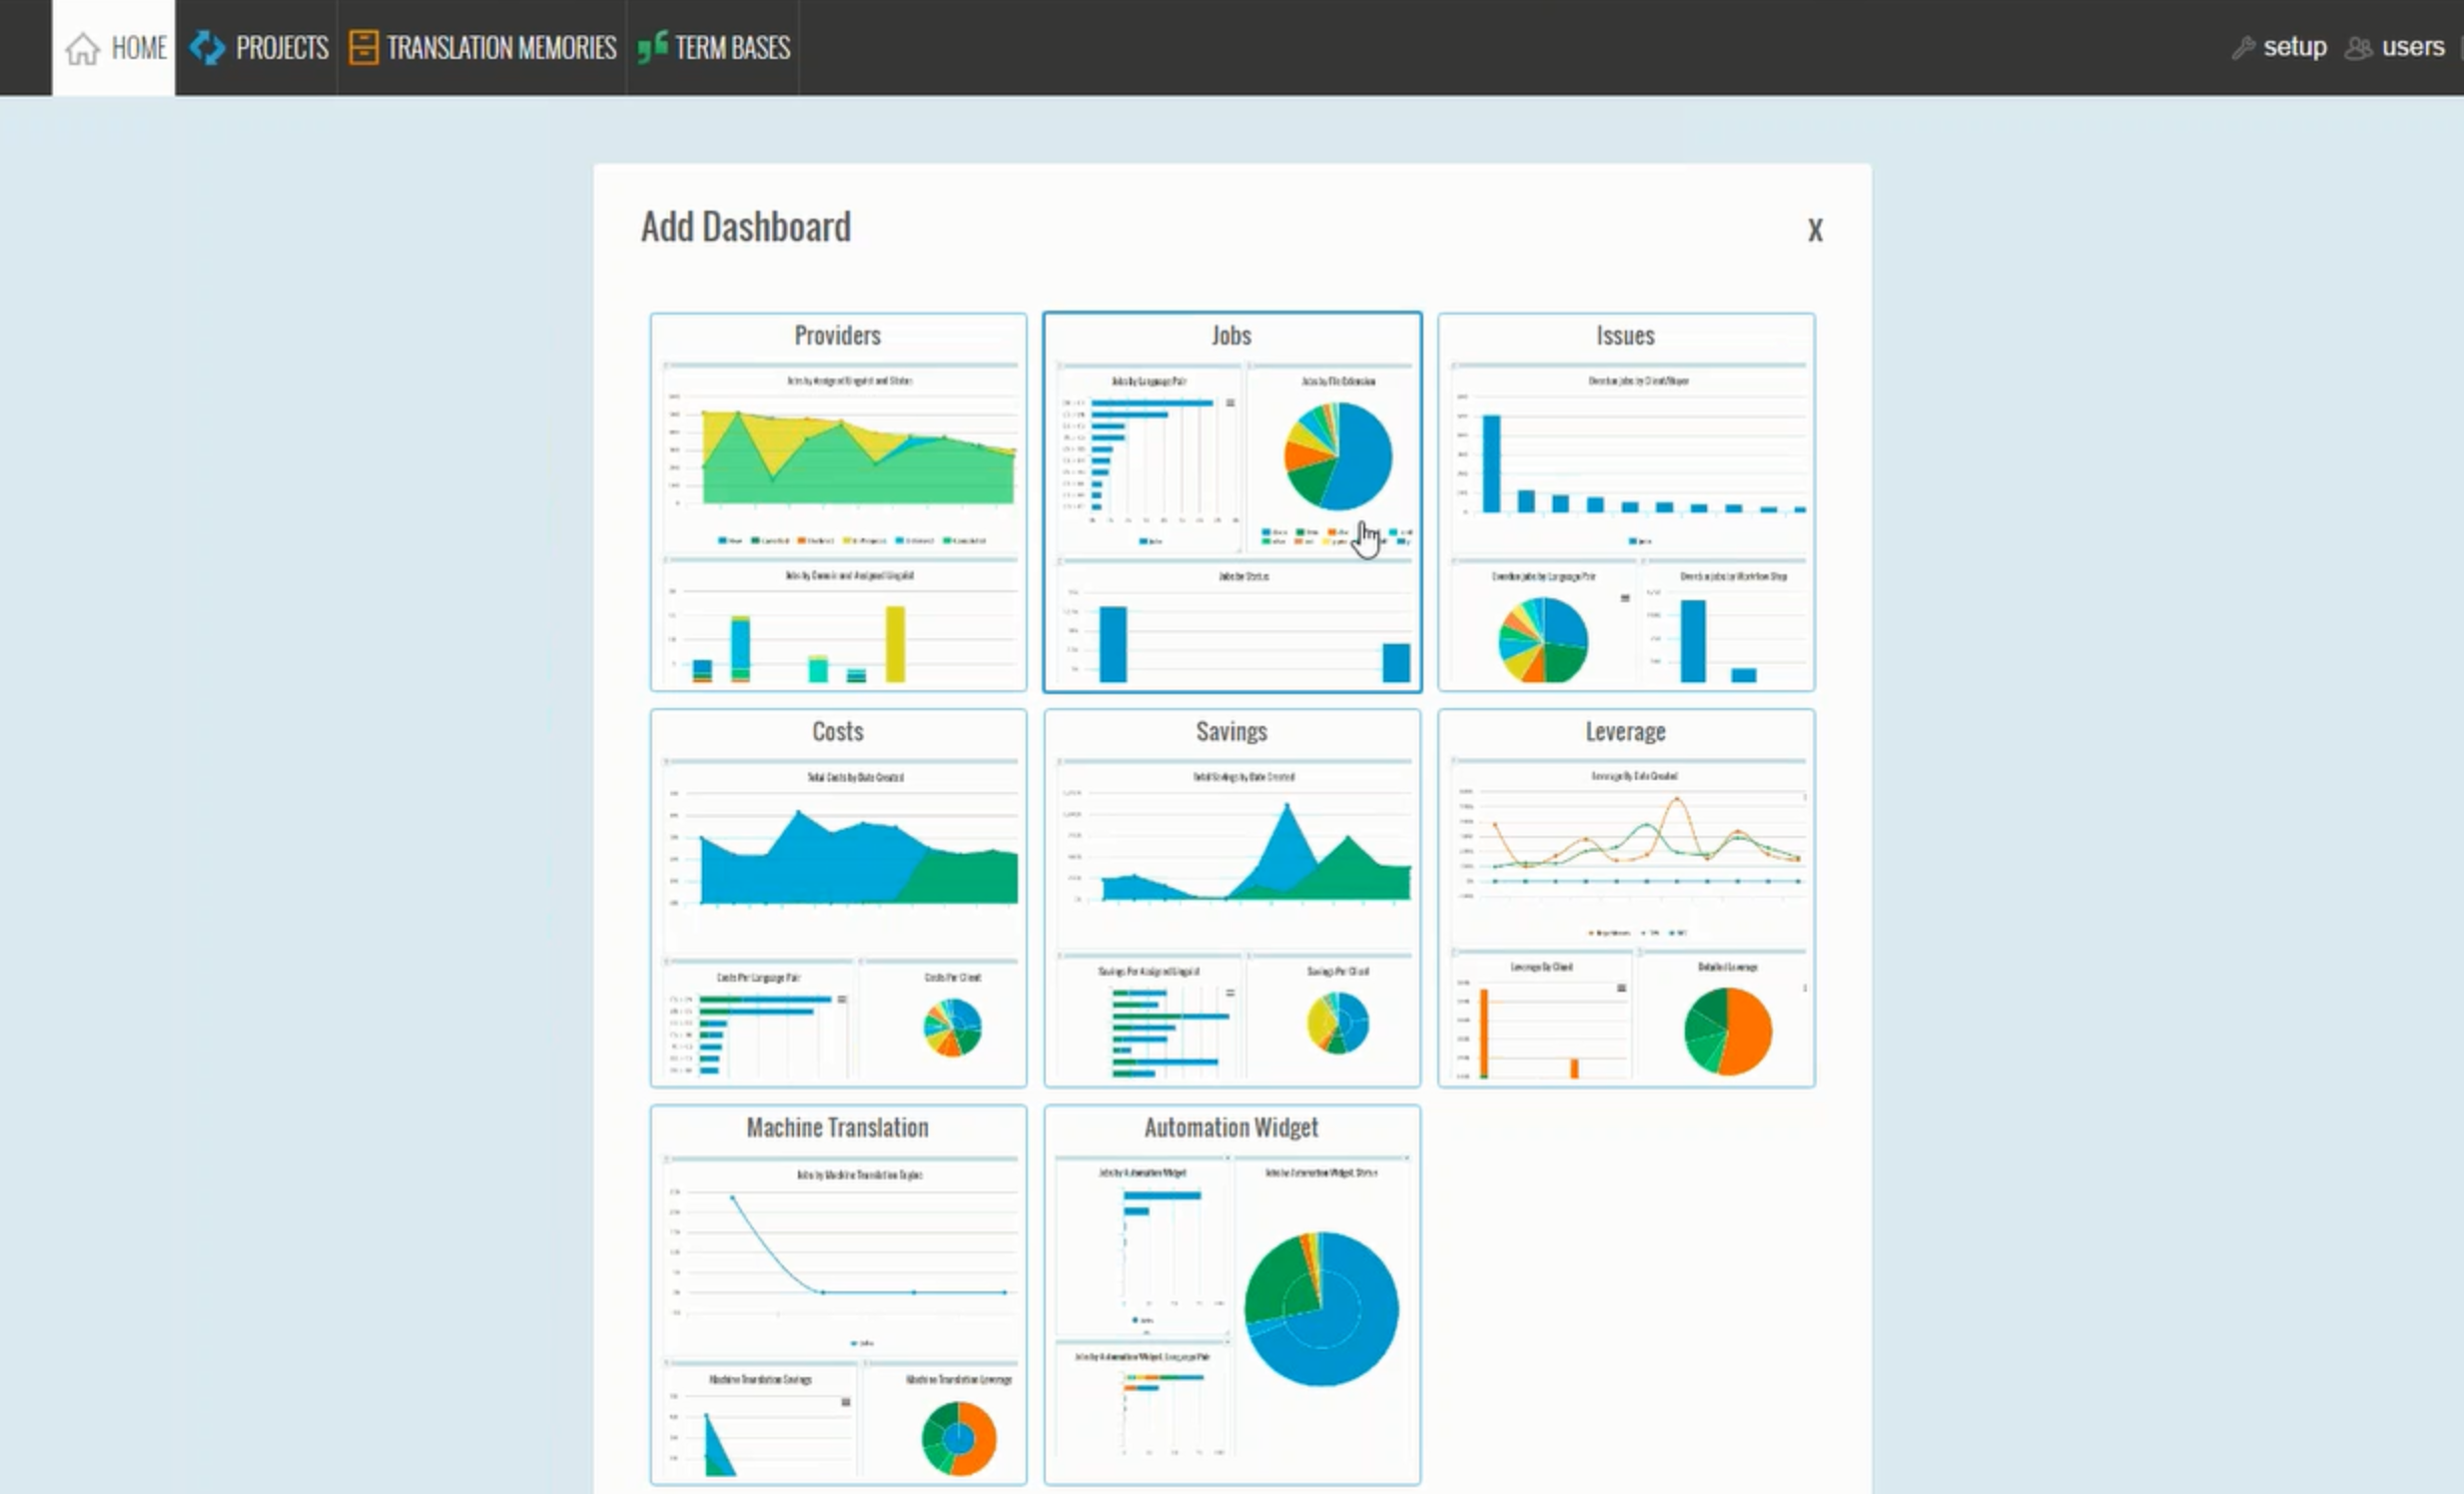
On the homepage, users can add and arrange the dashboards according to their preference. When users select “Add Dashboard” at the top of the page, they are presented with eight dashboard options: Providers, Jobs, Issues, Costs, Savings, Leverage, Machine Translation, and Automation Widget.
Webinar: Track Localization with Home Page Analytics Dashboards
Benefits of Analytics Dashboards
For Translation Agencies: Get an overview of current projects’ status, your team’s productivity, and savings from Machine Translation and Translation Memory.
For Translation Buyers: Analyze costs per vendor, see a status overview of all your current projects, and generate localization ROI reports.
Dynamic Dashboards
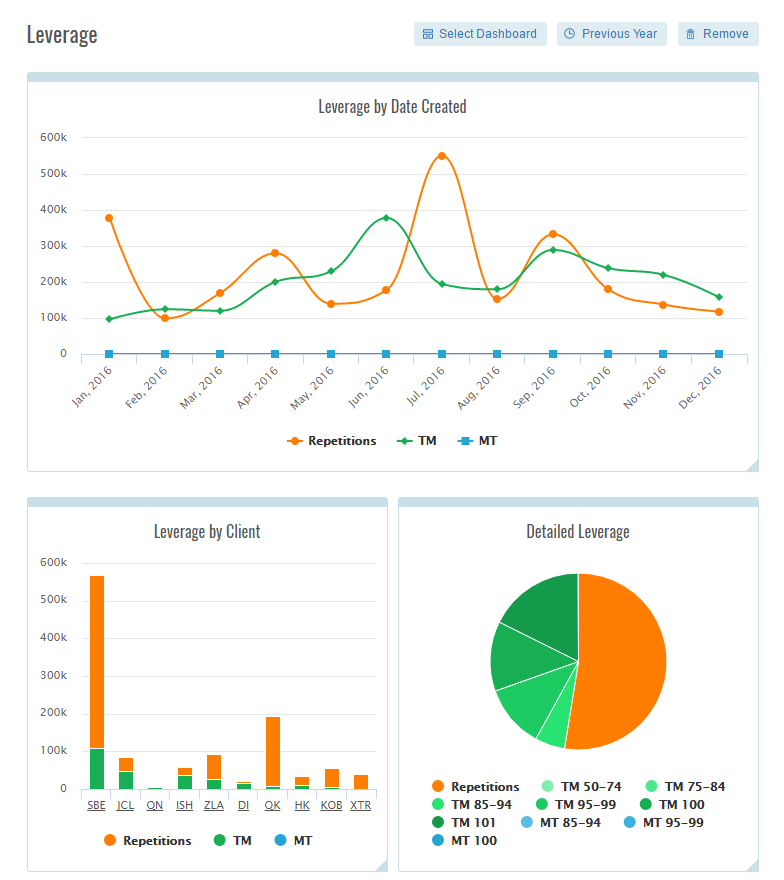
Each of the eight dashboards has a minimum of three charts with a breakdown of different features and reports. “Leverage” includes charts related to date created, savings with machine translation, translation memory, and repetitions, and savings from different clients or vendors.
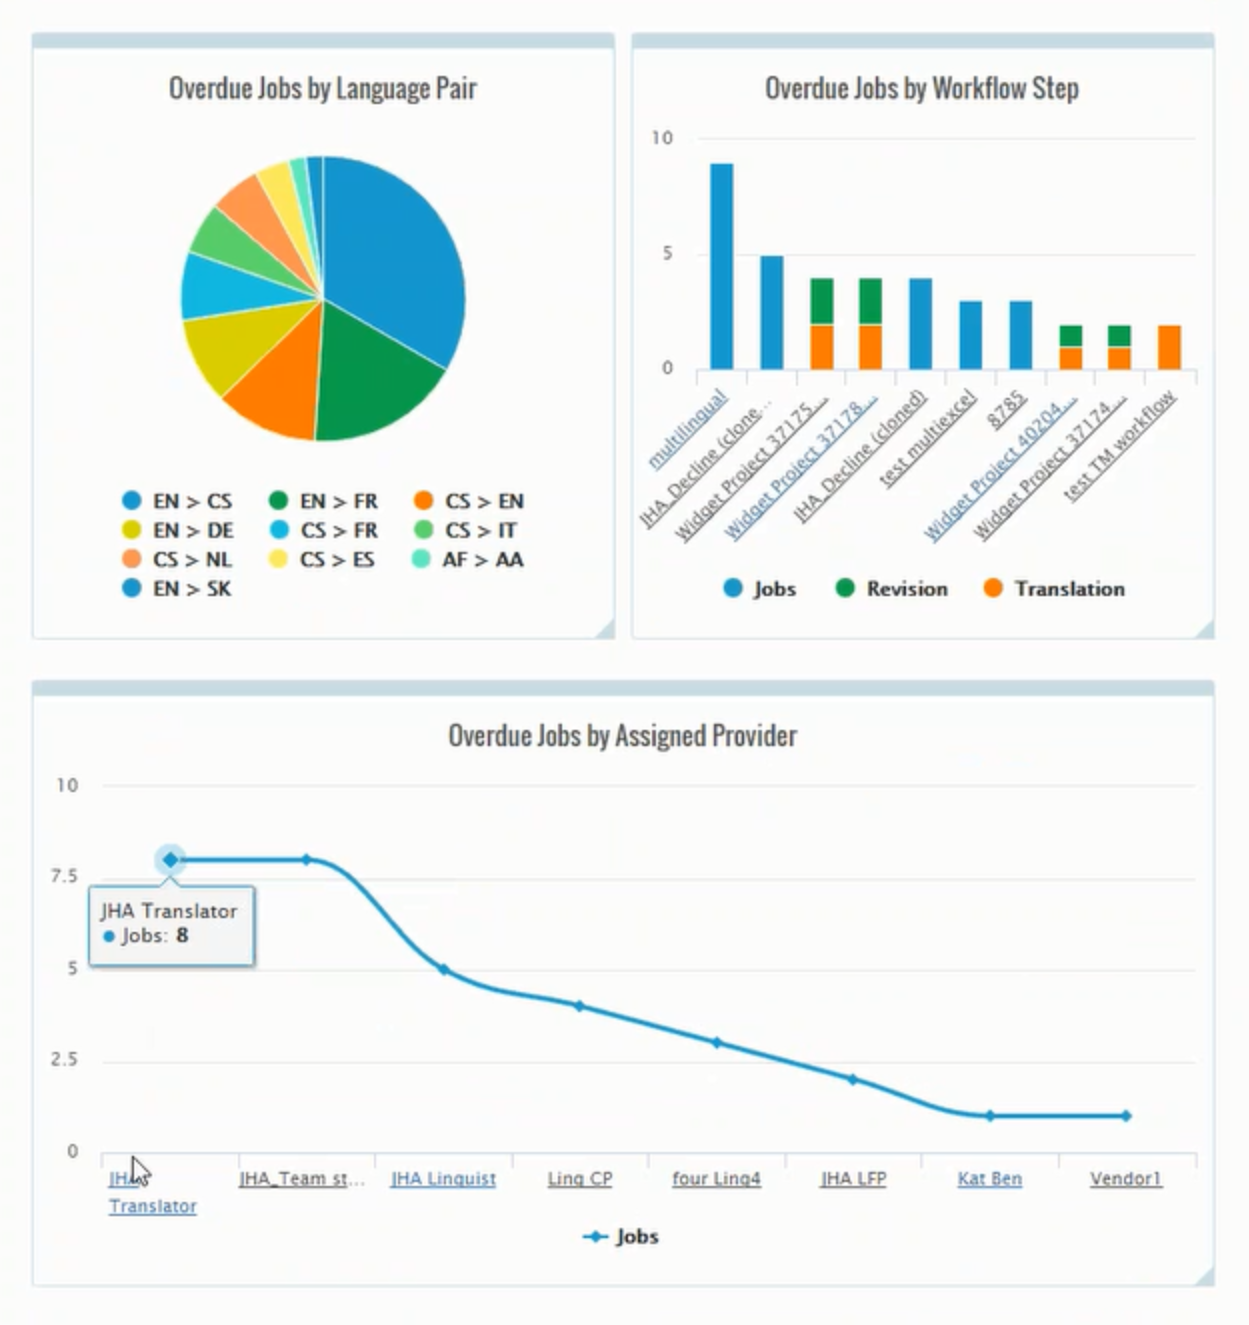
The charts are dynamic and adjustable - they can be arranged and resized as desired, and users can select and deselect options like language pairings, currencies, and time to create the desired report. Links of linguist names and projects will open a new window with additional information.
Financial Reporting for Localization
Dashboards with revenue-based data will give project managers and translation managers further insight into their costs and ROI for localization, as well as benchmark best practices.
Available dashboards to showcase financial reporting include:
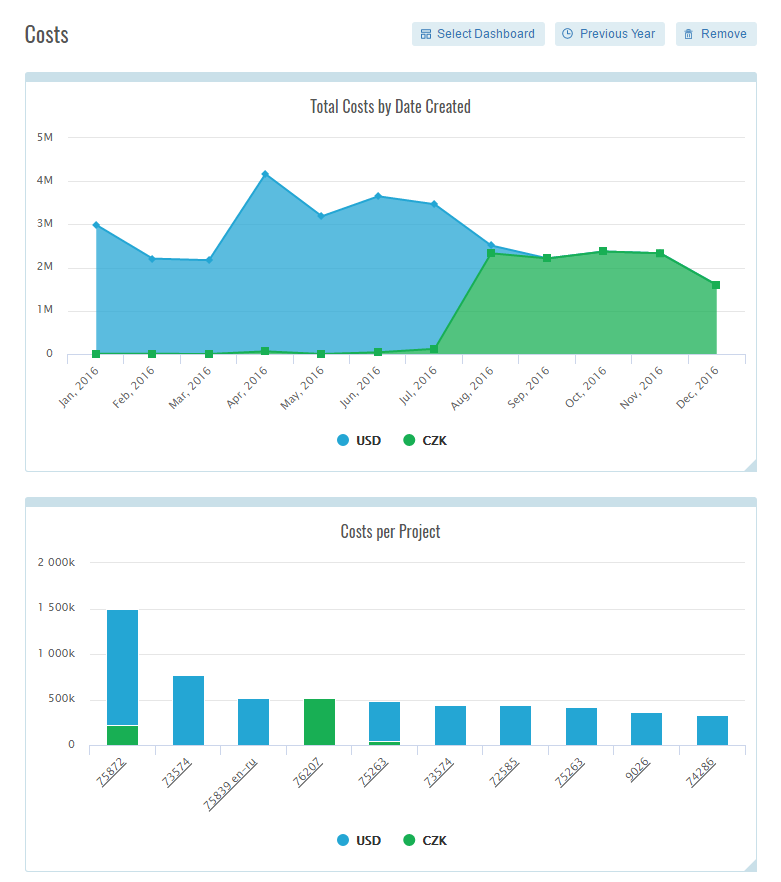
Costs and Savings - overview of costs in selected price list currencies and various cost breakdowns per language pairing, client, project, provider, and Automation Widget
Leverage - Savings from translation memory and machine translation, broken down by date created, language pair, client, matches, repetitions, and more.
Machine Translation - Savings from different Machine Translations connected to your account
The new analytics dashboards can help increase transparency of your localization process, create reports for senior management, calculate localization ROI, and identify best practices.
Webinar: Track Localization with Home Page Analytics Dashboards
Are you a Memsource user with specific metrics you would like to measure? Contact our Support Team with your feedback.